Two Sample Tests
8.6.1. Comparing Means of Two Populations
Gnumeric provides four similar tools to test whether the difference of two population means is equal to a hypothesized value. These four tools use the same dialog (see Figure 8-86).
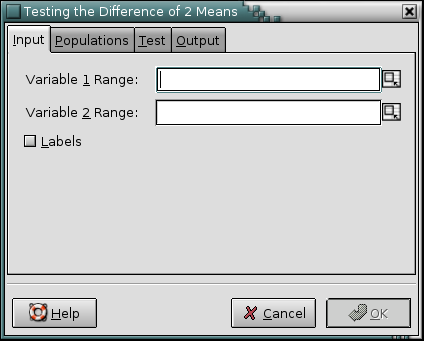
Depending on the options settings, the appropriate test will be performed. The entries in the “Input”, “Test”, and “Output” frames are independent from the specific test.
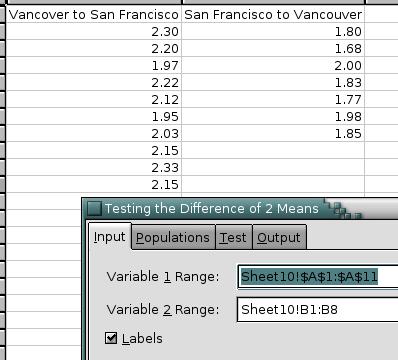
Enter the first variable in the “Variable 1 Range” entry and the second variable in the “Variable 2 Range” entry.
Enter the hypothesized difference between the population means in the “Hypothesized Mean Difference” entry, which has a default of 0. Enter the significance level in the “Alpha” entry, which has a default of 5 %.
Specify the output options as described above. If the output is printed into a range, it should have at least three columns and ten rows.
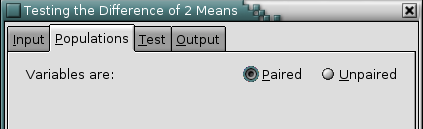
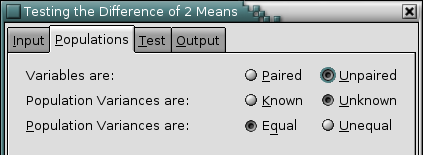
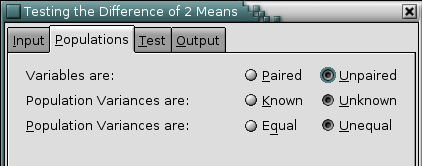
There are up to three possible options that can be selected:
- “Paired” versus “Unpaired”
If the variables are dependent (or paired) select the “Paired” option.
- “Known” versus “Unknown”
For unpaired or independent variables, the population variances may be known or unknown. In the latter case they will be estimated using the sample variances. Select the “Known” option if you in fact know the population variances prior to collecting the sample.
- “Equal” versus “Unequal”
For paired variables with unknown population variances, we may either assume that the population variances are equal or not. If the population variances are assumed to be equal, Gnumeric will estimate the common variance by pooling the sample variances. Select the “Equal” option to assume that the population variances are equal.
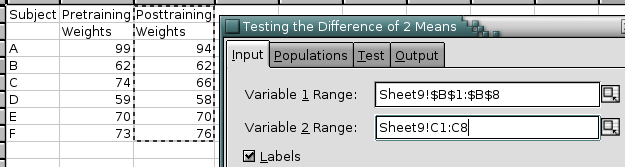
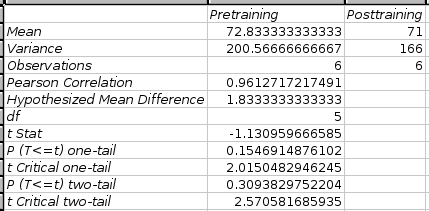
8.6.1.1. t-Test: Paired Two Sample for Means Tool
For paired variables, when you click on “”, Gnumeric will test whether the mean of the difference between the paired variables is equal to the given hypothesized mean difference.
See Figure 8-88 for an example of a completed dialog and Figure 8-89 for the corresponding output.
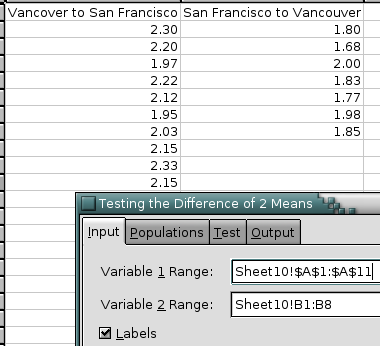
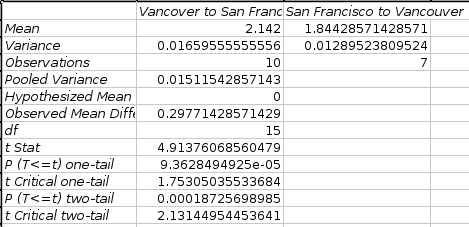
8.6.1.2. t-Test: Two-Sample Assuming Equal Variances Tool
For unpaired variables with unknown but assumed equal population variances, when you click on “”, Gnumeric will test whether the mean of the difference between the paired variables is equal to the given hypothesized mean difference.
See Figure 8-91 for an example of a completed dialog and Figure 8-92 for the corresponding output.
8.6.1.3. t-Test: Two-Sample Assuming Unequal Variances Tool
For unpaired variables with unknown and assumed unequal population variances, when you click on “”, Gnumeric will test whether the mean of the difference between the paired variables is equal to the given hypothesized mean difference.
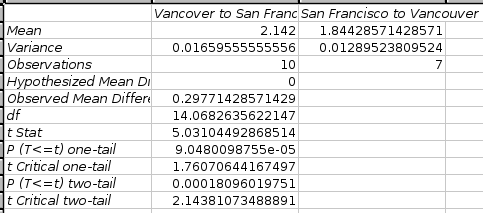
See Figure 8-94 for an example of a completed dialog and Figure 8-95 for the corresponding output.
8.6.1.4. z-Test: Two Samples for Means Tool
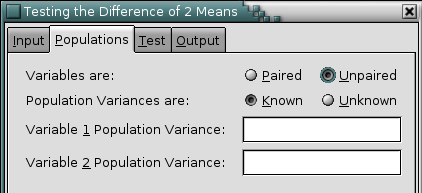
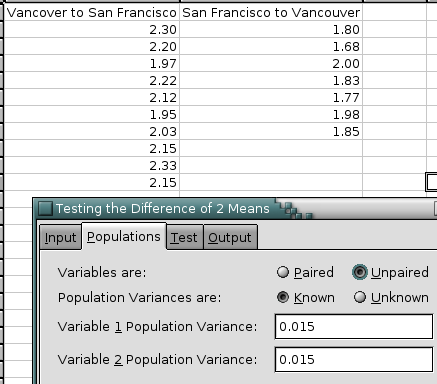
For unpaired variables with known population variances, enter those variances in the “Variable 1 Pop. Variance” and “Variable 2 Pop. Variance” entries. When you click on “”, Gnumeric will test whether the mean of the difference between the paired variables is equal to the given hypothesized mean difference.
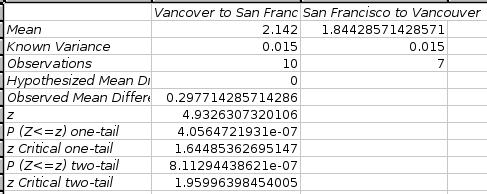
See Figure 8-97 for an example of a completed dialog and Figure 8-98 for the corresponding output.
8.6.2. Comparing Medians of Two Populations
Gnumeric provides three non-parametric tests to test the null hypothesis that the two samples come from populations with the same median. Two tests, performed through the same tool, apply in the case of paired samples:
- Sign Test
- Wilcoxon Signed Rank Test
One test applies in the case of unpaired samples:
- Wilcoxon-Mann-Whitney Test
- 8.6.2.1. Sign Test
- 8.6.2.2. Wilcoxon Signed Rank Test
- 8.6.2.3. Wilcoxon-Mann-Whitney Test
8.6.2.1. Sign Test
This section describes the two sample (paired) sign test to test the null hypothesis that the two samples come from populations with the same median. The tool to perform a sign test to test the null hypothesis that the single sample comes from a population with a given median is in section Section 8.5.2.1 ― Sign Test.
This section needs to be written.
8.6.2.2. Wilcoxon Signed Rank Test
This section describes the two sample (paired) Wilcoxon signed rank test to test the null hypothesis that the two samples come from populations with the same median. The tool to perform a Wilcoxon signed rank test to test the null hypothesis that the single sample comes from a population with a given median is in section Section 8.5.2.2 ― Wilcoxon Signed Rank Test.
This section needs to be written.
8.6.3. F-Test: Two-Sample for Variances Tool
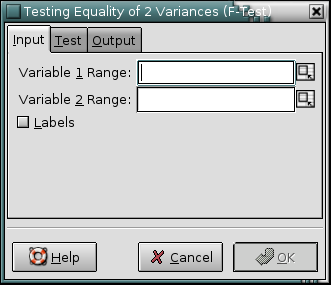
Use the F-Test tool to test whether two population variances are different against the null hypothesis that they are not.
Specify the variables in the “Variable 1 Range:” and “Variable 2 Range:” entries. The “Alpha:” entry contains the significance level which is by default 5%.
If the first field of each range contains labels, select the “” option. The names of the variables will be included in the output table.
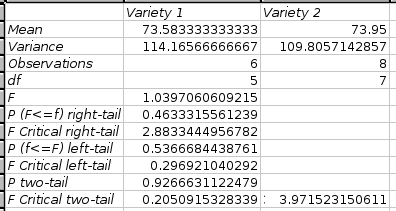
The results are given in a table. This table contains the mean, variance, count of observations and the degree of freedom for both variables. The output table also includes the F-value, the one-tailed probability for the F-value, and the F Critical value for one-tailed test and the corresponding values for a two tailed test. The one-tailed probability for the F-value (“P(F≤f) one-tail” row) is the probability of making a Type I error in the one-tailed test. Similarly, the two-tailed probability for the F-value (“P two-tail” row) is the probability of making a Type I error in the two-tailed test. Since in the two-tailed F-Test both critical values are positive, the “F Critical two-tail” row contains two numbers.
If the output is directed into a specific output range, that range should contain at least three columns and eight rows.
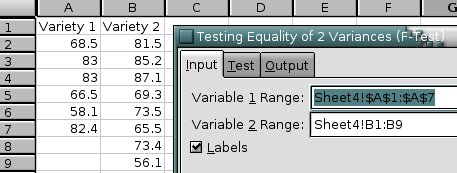
Figure 8-100 shows some example data and Figure 8-101 the corresponding output.