One Sample Tests
- 8.5.1. Normality Tests
- 8.5.2. One Median
8.5.1. Normality Tests
The normality test tool provides for four tests of normality.
- Anderson Darling Test
- Cramér-von Mises Test
- Lilliefors (Kolmogorov-Smirnov) Test
- Shapiro-Francia Test
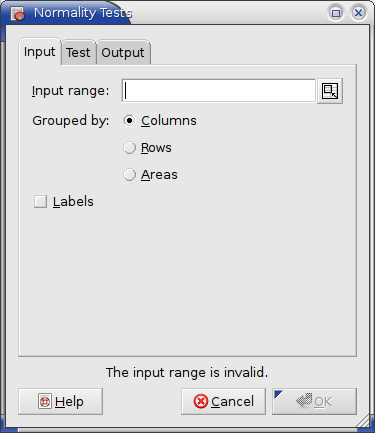
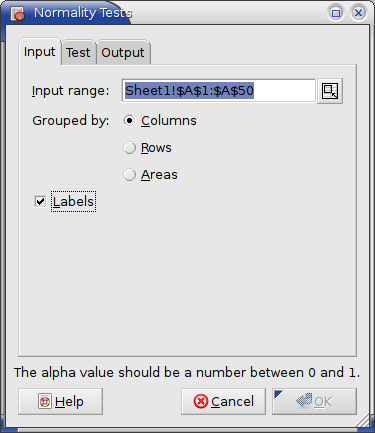
The data range is specified via the “Input Range:” entry (see Figure 8-76). The given range or list of ranges can be grouped into separate data sets by columns, rows, or areas. The tool performs a separate test for each data set.
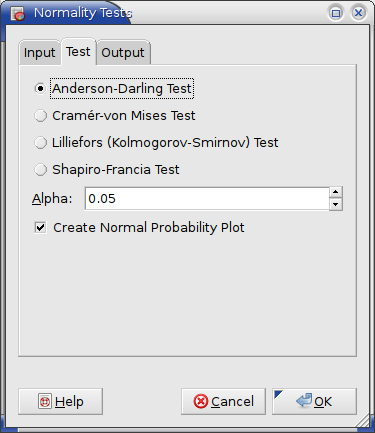
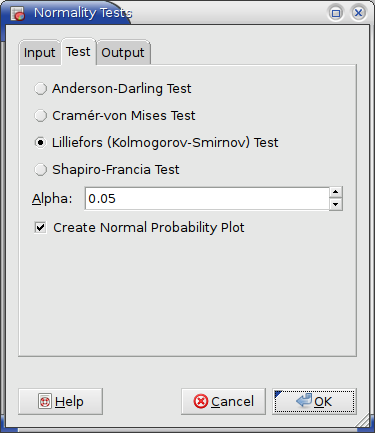
On the test tab one specifies which of the four tests to perform, the significance level for the test and whether to include a normal probability plot of the data (see Figure 8-77).
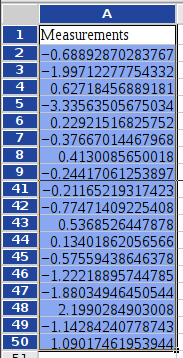
Suppose you want to perform a Lilliefors (Kolmogorov-Smirnov) Test for Normality on the data given in Figure 8-78.
- Enter A1:A50 (or Sheet1!$A$1:$A$50) in the “Input Range:” entry by typing this directly into the entry or clicking in the entry field and then selecting the range on the sheet.
- Select the “” option since the first row contains a label (see Figure 8-79).
- On the test tab of the dialog (see Figure 8-80) select the Lilliefors (Kolmogorov-Smirnov) Test.
- Specify an appropriate significance level Alpha, say 0.05.
- Select the “” option to include a normal probability plot in the output.
- Specify the output options as described above.
- Press the OK button.
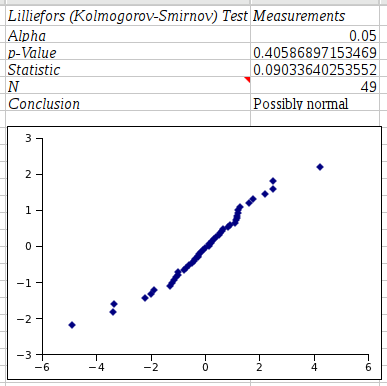
The output of this normality test is shown in Figure 8-81. Note that the graph appears initially on top of the output data and needs to be moved to make the data visible.
8.5.2. One Median
The One Median test tool provides two non-parametric tests that test the null hypothesis that the sample comes from a population with a given median:
- Sign Test
- Wilcoxon Signed Rank Test
Selecting the appropriate submenu item opens the dialog with the respective test preselected.
- 8.5.2.1. Sign Test
- 8.5.2.2. Wilcoxon Signed Rank Test
8.5.2.1. Sign Test
This section describes the one sample sign test to test the null hypothesis that the sample comes from a population with the given median. The tool to perform a sign test to test the null hypothesis that two paired samples come from populations with the same median is in section Section 8.6.2.1 ― Sign Test.
The Sign Test tool performs a one-sample sign test whether the sample comes from a population with a given median.
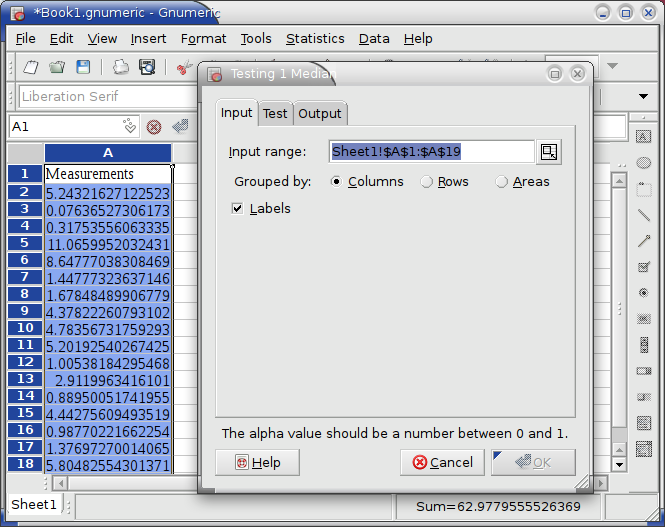
The sample data range is specified via the “Input Range:” entry (see Figure 8-82). The given range or list of ranges can be grouped into separate data sets by columns, rows, or areas. The tool performs a separate test for each data set.
On the “Test”tab of the dialog (see Figure 8-83) the predicted median as well as the significance level are specified.
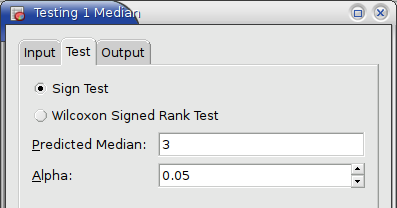
Suppose you want to perform a Sign Test on the data given in Figure 8-82 to determine whether the sample comes from a population of mean 3.
- Enter A1:A19 (or Sheet1!$A$1:$A$19) in the “Input Range:” entry by typing this directly into the entry or clicking in the entry field and then selecting the range on the sheet.
- Select the “” option since the first row contains a label. (see Figure 8-82).
- On the “” tab of the dialog (see Figure 8-83) select the Sign Test.
- Specify an appropriate significance level Alpha, say 0.05.
- Select thepecify the median of the null hypothesis (3) in the “” entry.
- Specify the output options as described above.
- Press the OK button.
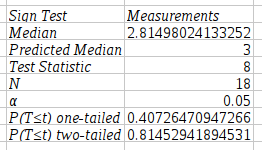
The output of this sign test is shown in Figure 8-84.
8.5.2.2. Wilcoxon Signed Rank Test
This section describes the one sample Wilcoxon signed rank test to test the null hypothesis that the sample comes from a population with the given median. The tool to perform a Wilcoxon signed rank test to test the null hypothesis that two paired samples come from populations with the same median is in section Section 8.6.2.2 ― Wilcoxon Signed Rank Test.
The Wilcoxon Signed Rank TTest tool performs a one-sample sign test whether the sample comes from a population with a given median.
The sample data range is specified via the “Input Range:” entry (see Figure 8-82). The given range or list of ranges can be grouped into separate data sets by columns, rows, or areas. The tool performs a separate test for each data set.
On the “Test”tab of the dialog (see Figure 8-83) the predicted median as well as the significance level are specified.
The p-values given by this tool are determined using a normal approximation. This approximation is only valid if the sample size is at least 12.
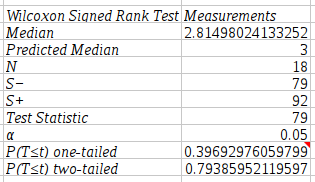
Suppose you want to perform a Wilcoxon Signed Rank Test on the data given in Figure 8-82 to determine whether the sample comes from a population of mean 3.
- Enter A1:A19 (or Sheet1!$A$1:$A$19) in the “Input Range:” entry by typing this directly into the entry or clicking in the entry field and then selecting the range on the sheet.
- Select the “” option since the first row contains a label. (see Figure 8-82).
- On the “” tab of the dialog (see Figure 8-83) select the Wilcoxon Signed Rank Test.
- Specify an appropriate significance level Alpha, say 0.05.
- Select thepecify the median of the null hypothesis (3) in the “” entry.
- Specify the output options as described above.
- Press the OK button.
The output of this sign test is shown in Figure 8-85.