The Cell Grid
Most of the work done on a spreadsheet is done to the main Cell area, the large grid like part of the worksheet. This is where all the formulas and data are entered, and is the center of activity for the spreadsheet.
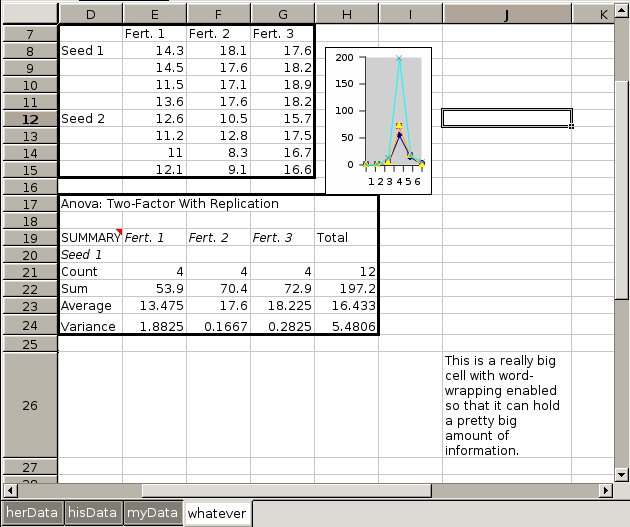
Figure 4-38 shows the cell grid area, the column and row headers on the top and left, the scrollbars on the right and bottom and the tab list at the very bottom.
The figure has a few and shows that cell B3 as being selected. In this figure, the columns and rows have been resized and therefore look uneven.
Each cell in this area is delimited by a light grey line by default. The current selection is indicated by a rectangular box with a little box on the lower right, this case cell J12. The view in this figure shows the middle portion of a worksheet which is evident in two ways. Firstly, the column and row headers do not start at column A and row 1. Secondly, the scroll thumbs are not at the top and left. The thumbs are the boxes within the scroll bars that are used to scroll. Note also that cell D19 has a comment within it which is shown by the little red triangle at the top right corner.
The size of a cell is determined by the width of the column and height of the row that the cell is in. The columns and rows can be resized by acting on the header relevant to the cell. The user must move the mouse pointer to the edge of the header which is either to the right or below the cell. With the mouse pointer in this position, the pointer will change to a set of opposite pointing arrows. The user must then drag this edge away from the top left corner. This takes a little practice.
The cell area is the core of Gnumeric. Therefore the manual explains the use of cells in much greater detail in a separate section. Interested users should read Chapter 5 ― Working with Data.
- 4.6.1. The Column and Row Headers
- 4.6.2. The Scrollbars
- 4.6.3. The Tabbed Sheet Indicator
4.6.1. The Column and Row Headers
The sheet is bordered by column headers on the top and row headers to the left. Columns are labeled alphabetically running horizontally across the top of the sheet as shown in Figure 4-39.
Rows are labeled along the left side of the worksheet. Each label is a different integer increasing downward. This is shown in Figure 4-40.
4.6.2. The Scrollbars
The cell grid area's scrollbars work like other scrollbars. In this case they let the user work on a worksheet which is much bigger than what could be shown at any given moment.
4.6.3. The Tabbed Sheet Indicator
At the bottom of Figure 4-38, Gnumeric has a tabbed sheet indicator. This is the boxes with the labels "Guppies", "Turtles", "Mermaids", "seahorses" and so on. In workbooks where there are more than one sheet, extra tabs are used to indicate how many sheets are there, and also allows the user to move to another sheet by clicking the proper tab. Each tab is a link to a separate worksheet within Gnumeric. In this figure, the "Turtles" tab has been selected. Gnumeric shows this by making the "Turtles" since the tab is a little bigger and making it overlap the two neighbouring tabs.
On the far right, the two arrows indicate that there are more sheets in the workbook and more tabs for those sheets. Unfortunately, there is not enough space to show them all so Gnumeric displays these arrows. If all the sheets are visible, these arrows will not be displayed. These arrows can be used to scroll the tabs and bring tabs that were hidden into view. This may be a little difficult to understand and work with but becomes easier quickly.