The Graph Guru
All graphs in Gnumeric are created using the Graph Guru which is a complex dialog that allows for detailed customization of each graph.
- 10.2.1. The components of the Graph Guru
- 10.2.2. Navigating the graph guru
10.2.1. The components of the Graph Guru
The Graph Guru consists of two panels which appear sequentially. The first panel allows the user to select the type of the plot, and possibly a sub-type and a style. The second panel provides a way to configure the style formats of each component of the final graph. Figure 10-3 shows the different areas of the two panels of the Graph Guru.
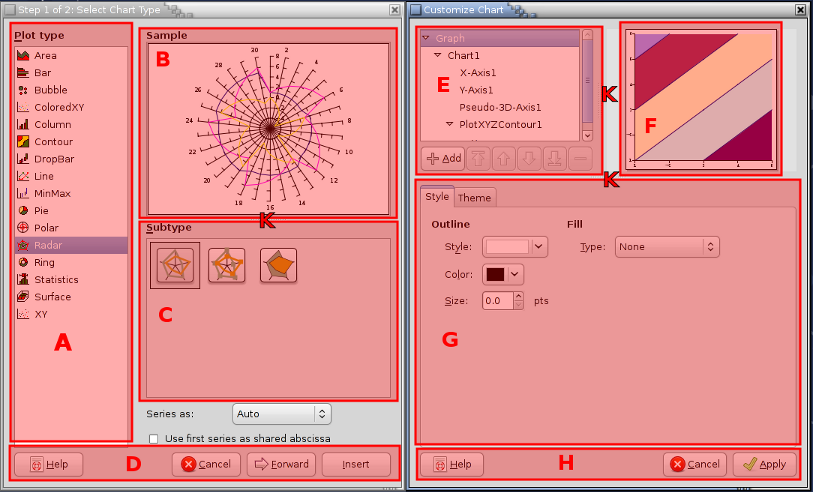
The different parts of each panel of the Graph Guru have been shaded with boxes of different colors and labeled with a letter in Figure 10-3. The purpose of each of these sections will be explained below:
- - The Plot Type Selection Area
-
This area lists the different types of plots which can be contained within the graph. The desired plot type can be selected simply by placing the mouse cursor over the desired type and clicking with the primary mouse button. The blue highlight indicates the currently selected type.
- - The Preview Area.
-
This area shows a preview of the currently selected plot type/sub type combination using the default settings for this type of plot.
- - The Plot Subtype Area.
-
This area presents a number of icons which change depending on the plot type that has been selected. Certain icons represent plot sub-types, for example, distinguishing plots with columns that are side by side from plots with stacked columns. Other icons represent different plot styles, for example distinguishing line plots in which each data point is labeled with a graphical symbol from line plots where data points do not have any symbol. The highlight box around one icon indicates which icon is currently chosen.
Hovering the mouse pointer over one of these icons causes a description of the plot type to be shown next to the icon.
- - The First Panel Navigation Buttons
-
These buttons enable the user to navigate through the Graph Guru.
- The Button
-
The button should cause this section of the manual to open.
- The Button
-
The button will dismiss the Graph Guru and return the user to the Gnumeric worksheet.
- The Button
-
The button will dismiss the first panel of the Graph Guru and open up the second panel.
- The Button
-
The button will dismiss the Graph Guru and allow users to insert the graph, as it is currently defined, into the worksheet. The resulting graph may not include any plots or data but it can be modified subsequently using the context menu's menu entry.
- - The hierarchy tree of graph components
-
This area allows the user to navigate the hierarchy of graph components. The components are arranged in a tree with nodes indicated by arrowheads. Components can be selected by clicking on the component name with the mouse pointer and nodes can be expanded or collapsed by clicking on the arrowheads. The selection of different components in this area will cause different property options to be displayed in area since each component in the hierarchy has its own specific properties.
Immediately below the hierarchy are buttons that allow a user to modify the hierarchy of components by adding components with the button or by removing components with the button. The allows the user to change the stacking order of charts, moving them up or down, or of data series, moving them toward the front or back.
- - The preview area
-
This area shows a preview of the graph as it will look if the user clicks on the or at the bottom of the panel, in area .
- - The component properties selection area.
-
This area allows the user to change the graph by modifying the properties of the component that is selected (highlighted in blue) in area . For components which have multiple properties these may be grouped into related sets and placed on different tabs. By clicking on the tabs at the upper left, a user can access the properties in each set.
- - The second panel navigation buttons
-
If the guru is opened to create a new graph the buttons in this are act in the same way as the buttons in the first panel, in area except that the is now a and takes the user back to the first panel.
If the guru is opened to modify an existing graph the following buttons are shown (as in the screenshot Figure 10-3).
- The Button
-
The button should cause this section of the manual to open.
- The Button
-
The button will dismiss the Graph Guru and return the user to the Gnumeric worksheet, leaving the graph unchanged.
- The Button
-
The button will dismiss the Graph Guru and apply the changes to the current graph.
- - The panel rearrangement handles
-
These triple dots in various places of the two panels of the graph guru indicate that the mouse can be used to change the size of the different areas. These handles can be used by placing the mouse pointer above a handle, clicking and holding with the primary mouse button, then dragging the handle to a new position, and then releasing the mouse button.
10.2.2. Navigating the graph guru
Graphs in Gnumeric are created using the Graph Guru. The process involved in using this 'guru' essentially follows the alphabetical labels presented in Figure 10-3.
-
Data Pre-selection
Advanced users generally start by pre-selecting at least some of the data they will use in their plots. However, this step requires a complete understanding graphs and this step is not described here. Section 10.5 ― Pre-Selecting Data will explain data preselection once the rest of the graphing process has been explained.
-
Launching the Graph Guru
The Graph guru can be started in two ways. One way to start the Graph Guru is to click, with the primary mouse button, on the toolbar graph button,
 . Another way is to select, from the
menu, the
menu item. Both
approaches will launch the Graph Guru.
. Another way is to select, from the
menu, the
menu item. Both
approaches will launch the Graph Guru.
-
Selecting the plot type, sub-type, and style.
The Graph guru opens to the first of two panels. The areas of this panel are shown in the left hand side of Figure 10-3. This panel enables the user to select the type of the first plot in the chart, and its sub-type and style. To make a graph with multiple plots, a user should start by selecting the first plot; subsequent plots can be added later.
-
Picking the plot type
The first area, area , provides a list of the plot types. The user can pick one of the types by placing the mouse pointer on top of that appropriate entry in the list and clicking the primary mouse button. The blue highlight indicates which plot type has been chosen. The characteristics of the different plot types are explained extensively in Section 10.3 ― Plot Types.
-
Picking the plot sub-type and style
The second area of the first panel of the Graph Guru, labeled in Figure 10-3, presents one or more icons. The icons presented in this area will change depending on what plot type is highlighted in area . The icons provide a way to select a sub-type of plot, for example, the icons for the column plot type provide the choice between plotting columns of each data series side-by-side or plotting these columns stacked upon each other. These icons may also provide a way to quickly select different styles for the plot type, for example the icons for the line type provide a choice between plotting a simple line or placing markers at the points along the line. The sub-type cannot be changed in the next panel of the Graph Guru without deleting the plot and creating a new one. However, the style choices can be altered in the next panel. The meaning of each of these icons is explained in Section 10.3 ― Plot Types below grouped by plot type. If data has been pre-selected, clicking on the will present a preview of the plot type in area .
-
Moving to the next panel
Once a plot type has been chosen in area and an icon selected in area , the first panel has been completed. Clicking on the button will dismiss the first panel of the Graph Guru and bring up the second panel.
-
-
Configuring the plot
The second panel of the Graph Guru enables users to configure the plot. This includes determining the values which will actually be plotted, adding titles to various components, labels to the data series, names to data categories, and changing the appearance of the different components.
The simplest way both to learn the hierarchy of components in Gnumeric graphs and to understand the properties which can be changed for each component is to work sequentially through all of the components while both noting the components which can be added, listed in the drop down menu when the button is pressed, and observing the properties of the component which can be altered, shown in the lower part of the panel, the area labeled in Figure 10-3. Each component in the hierarchy can be selected in turn using the complete tree of all the components presented in the top leftmost area, labeled . Components can be selected by placing the mouse pointer over their name in this tree and then clicking with the primary mouse button. The currently selected component is indicated by the blue highlight on that line. Changing the selected component will also change the properties listed in area . Tree nodes, indicated by arrowheads in front of the name of a component, can be expanded or collapsed with alternative mouse clicks.
The second panel of the Graph Guru only allows two types of actions to be performed: the hierarchy of component elements can be modified or the properties of an element can be altered.
Once the plot is sufficiently configured, it can be placed on the worksheet to assess its appearance. The user can return to this panel of the Graph Guru using the context menu on the graph. The Graph Guru is dismissed by clicking on the button.-
The component elements of the graph can be changed using the buttons in area . Elements can be added, deleted or re-ordered.
- Adding component elements
-
An element can be added by selecting the parent element in the hierarchy presented in area and then clicking and holding the button. This action will reveal a drop down list including all the possible elements that can be added. By moving the mouse pointer onto the drop down list and releasing the mouse button while the pointer is over an element, that element will be added. To add a plot to a chart, it is necessary to navigate into the sub-menu to select the plot type and then into that sub-menu to select a plot sub-type or style in a process that mimics the process of selecting a plot discussed above.
- Deleting component elements
-
An element can be deleted by selecting the element in the hierarchy presented in area , and then clicking the button below the hierarchy.
- Re-ordering component elements
-
The order of some of the elements can be interchanged using the button below the element hierarchy. For example, if an element has two titles, the order of the titles could be swapped. Similarly the vertical order of charts can be interchanged. The effect on plots and series is different. For those elements, the order button changes the stacking order in the front to back dimension. For example, if a chart has a bar plot and a line plot, the order button will change which of the two plots is visible in front of the other.
-
The bottom area of the second panel, area in Figure 10-3, allows the user to configure the properties of each element in the hierarchy. When there are many properties, they will be grouped into similar sets and placed on different tabs. The detailed explanation of how to configure each property of each element will be explained in Section 10.4 ― Configuring Graph Element Properties below.
-
Place the graph
After exiting the Graph Guru, the user must place the graph on a worksheet. Immediately after exiting the Graph Guru, the mouse pointer will have changed to the thin cross-hair cursor. The user can place the graph by moving the pointer over the worksheet and clicking once with the primary mouse button. Alternatively, the user can place and size the graph by determining two of the corners of the graph. This is done by moving the pointer onto the worksheet to the first corner, clicking and holding the primary mouse button, dragging the mouse pointer to the opposite corner and releasing the mouse button.
-
Modifying an existing graph
A graph which has already been created can be modified by clicking on the graph with one of the secondary mouse buttons in order to invoke the context menu and then selecting the menu entry. This will cause the second panel of the Graph Guru to appear which will enable the user to make any desired modifications. The use of the context menu was discussed in Section 9.1.4 ― Invoking the Context Menu for Graphical Elements.
-
Deleting a graph
A graph which has been made can be deleted by invoking the context menu and selecting the menu item.