Overview
Gnumeric provides several types of graphical elements which can be added to a worksheet. The creation, manipulation and deletion of these elements all occur in similar ways. When these elements are part of a worksheet, they all "float" above the cell grid, possibly hiding data in the cells underneath.
Gnumeric currently displays four different types of graphical elements: data graphs, images, widgets, and drawings. Data graphs allow users to present worksheet data visually in charts containing several kinds of plots including pie plots, bar and column plots, and scatterplots. Images in many standard computer formats can be added to a worksheet. Graphical user interface widgets can also be added to a worksheet and connected to the values contained in worksheet cells. Drawings allow users to add simple graphical elements on top of a worksheet including lines, arrows and simple polygons.
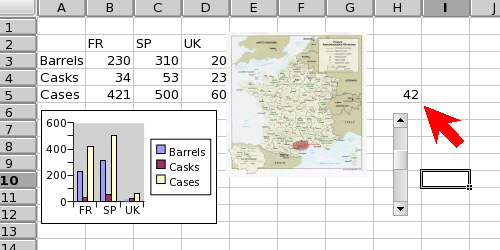
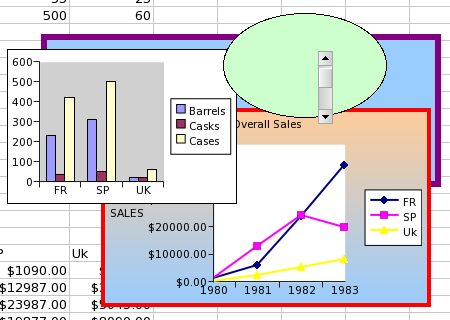
The four types of graphical elements which can be added to a worksheet: a data graph with a column plot, an image showing a map of France, a scrollbar which can be used to alter the value in cell "I6", and a red arrow drawing element.
The various graphical elements which can be added to a Gnumeric worksheet all behave in similar ways. The graphical elements all "float" above the cells in the cell grid and may obscure the contents of the cells behind, without affecting the contents of these hidden cells. All graphical elements are added in essentially the same way by selecting the element to add and then using the mouse, either with a simple click to place the element with a default size or with a click and drag to select the area of the worksheet to be covered by the element. These objects are moved or re-sized by clicking on the object with the primary mouse button and using the object body, border and "handles" (the small circles which appear at the corners and in the middle of each side) to manipulate the object. All of these objects will present a context menu through which to change the properties of the object, to save the object as an image, to change the stacking order (which graphical elements are in front of others), or to delete the object. Each of these operations will be summarized below and then explained in greater detail in the sections which follow.
- 9.1.1. Adding Graphical Elements
- 9.1.2. Selecting Graphical Elements
- 9.1.3. Moving and Resizing Graphical Elements
- 9.1.4. Invoking the Context Menu for Graphical Elements
- 9.1.5. Modifying Graphical Elements
- 9.1.6. Saving Graphical Elements as Images
- 9.1.7. Restacking Graphical Elements
- 9.1.8. Deleting Graphical Elements
9.1.1. Adding Graphical Elements
All graphical elements are added in similar ways which differ only in the original selection and configuration of the element. Data graphs are added using the Graph Guru, which is invoked either through the menu or with the toolbar button, to define the properties of the graph. Images are added using the menu menu entry, selecting the name of the file with the appropriate image and clicking on the button. Widgets and drawing elements are added by selecting the appropriate button on the object toolbar.
After any of these steps, the mouse cursor will change into a
thin cross-hair cursor,  ,
when the mouse pointer is placed over the cell grid area.
,
when the mouse pointer is placed over the cell grid area.
The graphical element can be placed in the workbook by moving the cursor onto the worksheet and clicking once with the primary mouse button. The graphical element will appear at its default size with the top right hand corner defined by the position of the mouse cursor.
Alternatively, the graphical element can both be placed on the worksheet and have its size determined which is done by click-dragging with the mouse. When the cursor has changed to the thin cross-hair, the graphical element can be inserted by moving the pointer over the worksheet to determine one of the corners of the resulting element, clicking and holding the primary mouse button, dragging the pointer to the opposite corner, and releasing the mouse button. The graphical element will then appear between the place where the primary mouse button was pressed and the place the button was released.
9.1.2. Selecting Graphical Elements
Selecting the graphical element requires placing the mouse pointer over the element and then clicking the primary mouse button. Gnumeric indicates the element is selected by drawing eight 'grab handles' around the element; these are small circles at the four corners and in the middle of the four edges of a rectangle surrounding the graphical element.
The graphical column plot has been selected as evidenced by the eight small circular 'grab handles' at the corners and in the middle of each edge.
The mouse pointer will also change shape when placed over a
selected element or over the element's 'grab handles'. When the
pointer is placed over a selected element, the mouse pointer
will change to the 'move' shape, ![]() ;
when the pointer is placed over the element's 'grab handles' it
will change to one of the resizing mouse pointer shapes, which
are presented in Section 4.8 ― The Mouse Pointers used by Gnumeric.
;
when the pointer is placed over the element's 'grab handles' it
will change to one of the resizing mouse pointer shapes, which
are presented in Section 4.8 ― The Mouse Pointers used by Gnumeric.
Some elements, such as the widget scrollbars, may be difficult to select because they interact themselves with the primary mouse button. An alternative selection process, which involves first invoking the context menu and then dismissing it, can be used for these elements and will work with any graphical element. When the mouse pointer is anywhere over the graphical element, clicking with one of the secondary mouse buttons will cause the element to be selected and a context menu to appear. If the primary mouse button is then pressed while the pointer is anywhere over the desktop other than over the menu, the context menu will be dismissed but the element will stay selected.
9.1.3. Moving and Resizing Graphical Elements
Graphical elements can be moved from their original location on the worksheet or can be changed in size or shape. All of these operations first require selecting the graphical element with the primary mouse button and then using this mouse button and the mouse pointer to manipulate the element.
- 9.1.3.1. Moving elements with the mouse
- 9.1.3.2. Moving elements with the arrow keys
- 9.1.3.3. Resizing and reshaping elements
9.1.3.1. Moving elements with the mouse
Moving the graphical element can be performed by first selecting
the graphical element, then placing the mouse pointer over the
element which will change it to the 'move' mouse shape,
![]() ,
clicking and holding the primary mouse button and moving the
mouse pointer to a new location. As the mouse is moved with the
primary mouse button held down, the graphical element will move
along with the mouse cursor. When the mouse button is released,
the object will stay in its new location.
,
clicking and holding the primary mouse button and moving the
mouse pointer to a new location. As the mouse is moved with the
primary mouse button held down, the graphical element will move
along with the mouse cursor. When the mouse button is released,
the object will stay in its new location.
9.1.3.2. Moving elements with the arrow keys
Once they are selected, graphical elements can be moved with the arrow keys on the keyboard. The movement can be made in smaller increments if the Ctrl key is held simultaneously.
9.1.3.3. Resizing and reshaping elements
Changing the size or shape of the graphical element can be performed by selecting the graphical element, placing the mouse pointer over one of the 'grab handles' at the corners or edges of the rectangular box around the element, which will cause the mouse pointer to change shape to one of the resize pointers, clicking and holding with the primary mouse button, dragging the corner or edge to a new position, and releasing the mouse button. If one of the corner 'grab handles' is used, the graphical element can be altered into any new rectangular shape and size. If one of the edge handles is used, the element can only be reshaped perpendicular to the chosen edge.
9.1.4. Invoking the Context Menu for Graphical Elements
Many operations on graphical elements, including changing their internal properties, saving elements as images, modifying the stacking order of the elements, and deleting the elements, are performed through the context menu. The context menu appears when the mouse pointer is placed over the graphical element and one of the secondary mouse buttons is clicked. When the mouse pointer moves over a graphical element, it will change from the usual wide cross cursor to a right pointing arrow cursor. Clicking with the primary mouse button will select the graphical element but clicking with one of the other mouse buttons will open the context menu. The specific button that will trigger this menu depends on the specific hardware and configuration of the computer. By default it is usually the rightmost mouse button.
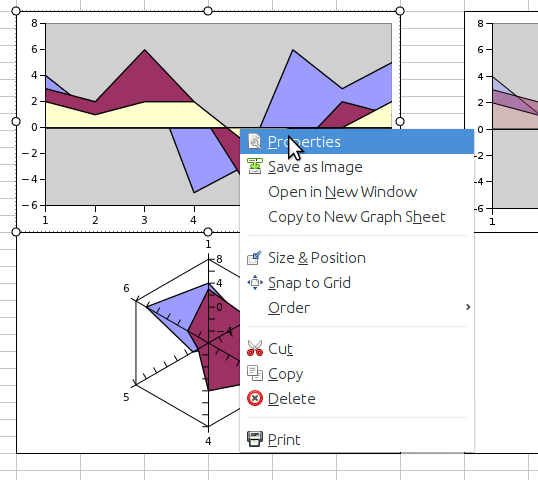
The context menu for graph elements is the most complete. It includes an entry to modify the internal properties of the graph, an entry to save the graph as an image, four entries to reorder the stacking of the graph in front or behind other graphs and one entry to delete the graph.
The context menu for graphical elements contains a sub-menu labelled which allows the user to change the presentation order for overlapping graphical objects.
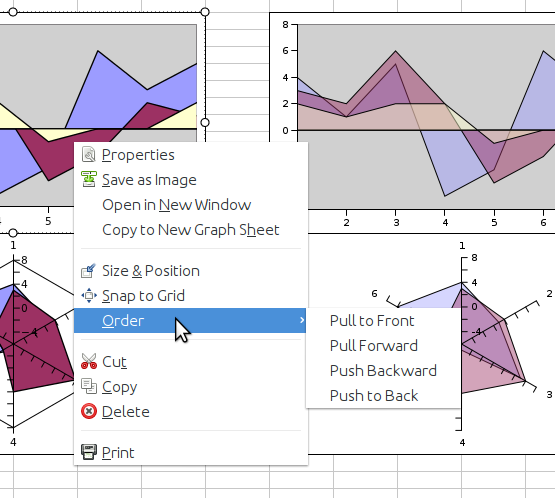
The order submenu of the context menu for graph elements allows the user to change the stacking order for the various graphs on the worksheet. This will affect which objects are visible in front of other objects when several objects overlap.
9.1.5. Modifying Graphical Elements
Many of the graphical elements have internal properties which can be changed. This includes the contents of a particular graph, the association of a widget and the contents of a spreadsheet cell, or the characteristics of a drawing element. These properties can be altered using the menu item in the context menu which appears when the mouse pointer is placed over the graphical element and one of the secondary mouse buttons is clicked. After the context menu appears, clicking on this menu item will open up a dialog allowing the user to alter the properties of the element. Since these properties are specific to each element, these dialogs will be discussed in each of the sections below.
9.1.6. Saving Graphical Elements as Images
Some of the graphical elements, the data graphs and the image elements, provide an item in the context menu which allows the element to be saved to a file containing only an image of that element. Graphical plots can be saved in Scalable Vector Graphics (SVG), Portable Network Graphics (PNG) or JPEG formats. Images can be saved to their original format, or to PNG and JPEG formats.
Elements which can be saved as images can be output to a file using an entry in the element's context menu. First the context menu must be invoked by placing the mouse pointer over the graphical element and clicking with one of the secondary mouse buttons. Next the or the menu items must be selected by placing the mouse pointer over that item and clicking with the primary mouse pointer. This will open up the Save As dialog which will allow the user to name the file which will be created, select where the file will be created, select the file type to use for the image and then generate the file.
9.1.7. Restacking Graphical Elements
Graphical elements can overlap when they are placed over the cell grid area. Conceptually, each graphical element occupies one layer in a stack of all the elements. By default, elements which have been created more recently will overlap in front of elements which were created earlier.
The order of each element in the stack can be changed using the four menu items in the context menu. The will bring the selected element in front of all the other objects. The menu item will bring the selected element forward one layer. Conversely, the menu item will move the selected element one layer towards the back, and the menu item will palace the selected element at the very back of the stack of elements. Jointly, these menu items allow the user to specify exactly which order in which the graphical elements should appear.
The stacking of graphical elements in Gnumeric is currently not working correctly. Widget elements are always placed above the other elements and do not honor the same ordering scheme as the rest of the elements. A large amount of work will be required to fix this and a decision has been made to ignore this problem until the developers have the time to fix this problem correctly.
9.1.8. Deleting Graphical Elements
All of the graphical elements in Gnumeric can be deleted using the context menu. Deleting a graphical element will never alter the data contents of the cells in the workbooks.
Deleting a graphical element requires using the context menu. First the mouse pointer must be placed over the graphical element. Next, the context menu must be invoked by clicking with one of the secondary mouse buttons. Finally, the menu item must be selected by placing the mouse pointer over this menu item and clicking with the primary mouse button. When this menu item is selected, the graphical element will disappear from the worksheet and will not be saved as part of the spreadsheet file the next time the file is saved.