Statistics
The statistics program allows you to visualise the power consumption of your laptop hardware.
This has been removed from the information window of previous versions of GNOME Power Manager as the data interface is now using DBus rather than internal IPC. This allows other applications to query and display the data if required.
You may not see some options or graphs if your computer does not have the required hardware. You may also see other hardware not shown here (for example UPS devices) but these are treated the same way as other devices.
- 4.1. Charge History
- 4.2. Power History
- 4.3. Estimated Time History
4.1. Charge History
This graph shows the percentage charge available for the composite primary battery, so if you have a main laptop battery and an auxiliary battery then only the averaged value will be shown. A legend is not shown with this graph.
4.2. Power History
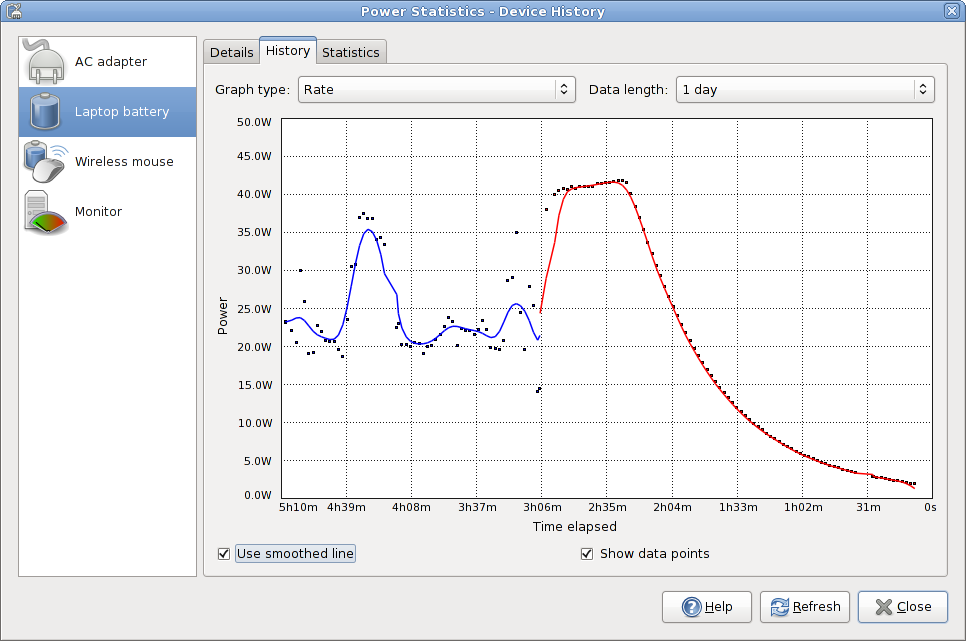
This graph shows the power history charge used by the composite primary battery. This line represents the amount of power that is either being used to charge the batteries in the system, or the power being used by the system from the batteries. You should see the line go up when processor-intensive tasks are performed, and down when the system is idle, or when the screen is dimmed. A legend is shown with this graph when data events have been received.
You do will not receive rate data from your computer if it is not charging or discharging, or if the computer is suspended. This is due to hardware limitations where the rate is only sent from the battery management chip, rather than the power management chip on the motherboard.
4.3. Estimated Time History
This graph shows the estimated charge history for the composite primary battery. This line represents the amount of time required until charged, or the amount of time until discharge. This line should go proportionally up when the rate decreases and down when the rate increases. A legend is shown with this graph when data events have been received.

