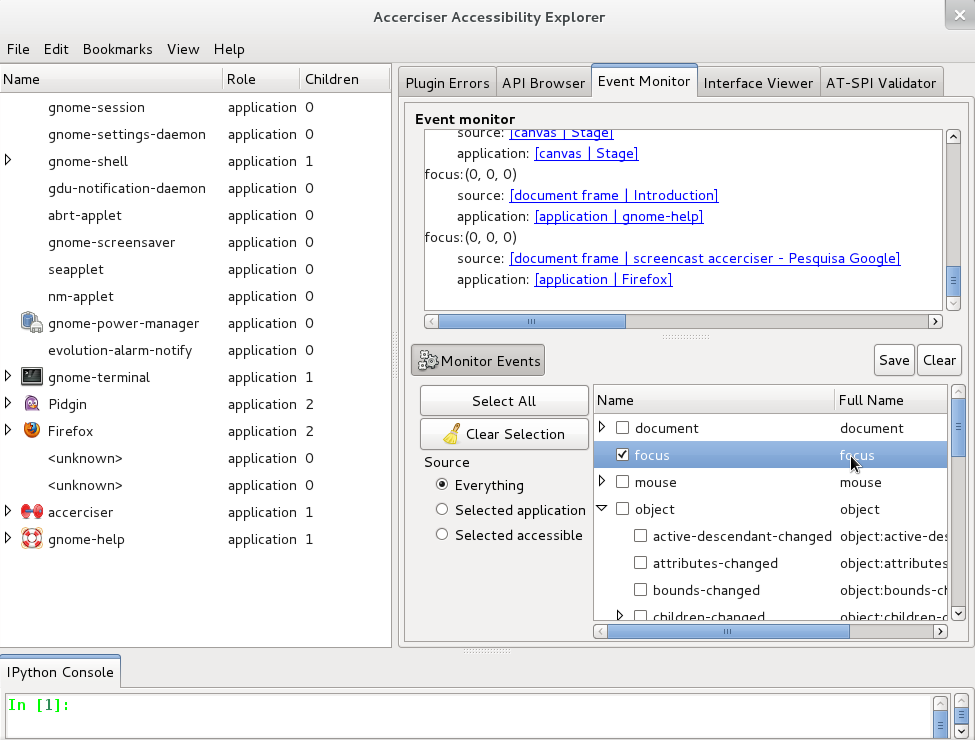
The Event Monitor Plugin allows you to view AT-SPI events as they occur on the applications exposed in Accerciser's Application Tree View. The plugin is useful to explore the dynamics of an application's interface and verify which accessible widgets are related to which AT-SPI events.
When you open the Event Monitor Plugin, you see a list of checkboxes representing all the different AT-SPI event classes covered by the plugin:
document
focus
mouse
object
terminal
window
If you check a class, all of its event types will be monitored by the plugin. The classes are exposed as tree structures; therefore, you can refine your selection by expanding them and checking only the event types you really care about.
If you want to monitor all possible types of AT-SPI events, press the Select All button. Similarly, if you want to clear all currently selected event types, press the Clear Selection button.
Selecting only a few event types per monitoring gives you a clearer output.
Another way to refine event monitoring is by the event source. By default, the Source option Everything is selected, indicating that AT-SPI events of all applications will be monitored. If you want to investigate a single application, select it in the Application Tree View and click the Source radio button Selected application. Likewise, if you want to monitor a single accessible widget and its corresponding descendants, select it in the Application Tree View and click the Source radio button Selected accessible.
After selecting event types and specifying a Source option, the Event Monitor Plugin starts monitoring AT-SPI events automatically, because the Monitor Events button is pressed by default. Whenever you want to stop monitoring, click the Monitor Events button. To restart monitoring, press this button again.
For each incoming event, the Event Monitor Plugin indicates the source and the application. Activating the link for either of these items will cause it to become selected in the Application Tree View.
If you want to save the output generated by the Event Monitor Plugin, just press the Save button. To clear the output screen, you just need to click the Clear button.
Got a comment? Spotted an error? Found the instructions unclear? Send feedback about this page.